Concepts
Linear Equations
The equation of a straight line is the linear equation. It could be in one variable or two variables.
Linear Equation in One Variable
The equation with one variable in it is known as a Linear Equation in One Variable.
The general form is
px + q = s, where p, q and s are real numbers and p ≠ 0.
Example
x + 5 = 10
y – 3 = 19
These are called Linear Equations in One Variable because the highest degree of the variable is one.
Graph of the Linear Equation in One Variable
We can mark the point of the linear equation in one variable on the number line.
x = 2 can be marked on the number line as follows -

Linear Equation in Two Variables
An equation with two variables is known as a Linear Equation in Two Variables. The general form of the linear equation in two variables is
ax + by + c = 0
where a and b are coefficients and c is the constant. a ≠ 0 and b ≠ 0.
Example
6x + 2y + 5 = 0, etc.
Slope Intercept form
Generally, the linear equation in two variables is written in the slope-intercept form as this is the easiest way to find the slope of the straight line while drawing the graph of it.
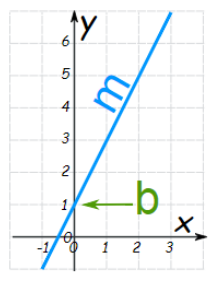
The slope-intercept form is

Where m represents the slope of the line.
and b tells the point of intersection of the line with the y-axis.

Remark: If b = 0 i.e. if the equation is y = mx then the line will pass through the origin as the y-intercept is zero.
Solution of a Linear Equation
- There is only one solution in the linear equation in one variable but there are infinitely many solutions in the linear equation in two variables.
- As there are two variables, the solution will be in the form of an ordered pair, i.e. (x, y).
- The pair which satisfies the equation is the solution of that particular equation.
Example:
Find the solution for the equation 2x + y = 7.
Solution:
To calculate the solution of the given equation we will take x = 0
2(0) + y = 7
y = 7
Hence, one solution is (0, 7).
To find another solution we will take y = 0
2x + 0 = 7
x = 3.5
So another solution is (3.5, 0).
Graph of a Linear Equation in Two Variables
To draw the graph of linear equation in two variables, we need to draw a table to write the solutions of the given equation, and then plot them on the Cartesian plane.
By joining these coordinates, we get the line of that equation.
- The coordinates which satisfy the given Equation lies on the line of the equation.
- Every point (x, y) on the line is the solution x = a, y = b of the given Equation.
- Any point, which does not lie on the line AB, is not a solution of Equation.
Example:
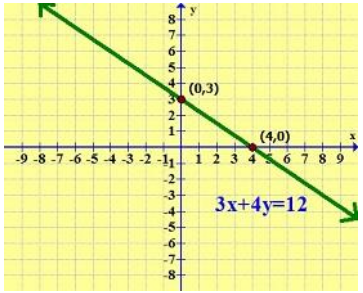
Draw the graph of the equation 3x + 4y = 12.
Solution:
To draw the graph of the equation 3x + 4y = 12, we need to find the solutions of the equation.
Let x = 0
3(0) + 4y = 12
y = 3
Let y = 0
3x + 4(0) = 12
x = 4
Now draw a table to write the solutions.
| x | 0 | 4 |
| y | 3 | 0 |
Now we can draw the graph easily by plotting these points on the Cartesian plane.

Equations of Lines Parallel to the x-axis and y-axis
When we draw the graph of the linear equation in one variable then it will be a point on the number line.
x - 5 = 0
x = 5
This shows that it has only one solution i.e. x = 5, so it can be plotted on the number line.
But if we treat this equation as the linear equation in two variables then it will have infinitely many solutions and the graph will be a straight line.
x – 5 = 0 or x + (0) y – 5 = 0
This shows that this is the linear equation in two variables where the value of y is always zero. So the line will not touch the y-axis at any point.
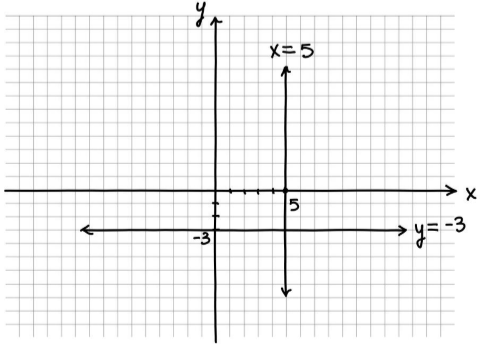
x = 5, x = number, then the graph will be the vertical line parallel to the y-axis.
All the points on the line will be the solution of the given equation.

Similarly if y = - 3, y = number then the graph will be the horizontal line parallel to the x-axis.

